The Townsville Dry Tropics Report Card provides our community with an independent picture of the health of our waterways and Reef.
The catchment area covers a land area of about 134,000km2 and 12,000km2 of sea area. It includes the greater Townsville area and extends north to Crystal Creek and south to Alligator Creek (near Cape Cleveland). The marine area includes Cleveland Bay and Halifax Bay, Magnetic Island, the Palm Island Group, and offshore to the outer boundary of the Great Barrier Reef Marine Park.

What is the Dry Tropics region?
The term “dry tropics” refers to the region which has an average rainfall range of 500 mm to 1000 mm per year. Most rainfall occurs over a few weeks during the summer months. The Dry Tropics region in Queensland is typically defined by the Burdekin River watershed and waterways north and south of Townsville.
Why do we need to know about the health of our waterways and catchments?
Townsville, Magnetic Island and the Palm Islands are situated within the dry tropics region of Queensland and represent the largest urban centre adjacent to the Great Barrier Reef. Our community has strong connections to the water and relies on the numerous social and economic benefits provided by our freshwater, estuarine and marine environments. The area also supports the Australian Institute of Marine Science and James Cook University, which are internationally renowned hubs for marine and coral reef science and research. The area supports the largest general cargo port in Northern Australia.
Understanding the condition of our waterways and catchments is important for identifying which areas are healthy and others which may need improving. It is also important to determine and understand the potential impacts affecting our waterways. This information will help us track improvements over time and help decision-makers target investment where it is needed most.
How do we know Report Cards work or have any value?
Our waterways, including rivers, creeks, estuaries, wetlands and the marine environment, are important to the Townsville community, for both social and economic reasons. They play a central role in the daily life of North Queensland and are important for Townsville’s productivity and liveability.
By presenting information on both environmental and socio-economic health, the report card provides a more holistic approach to waterway management. The Report Card provides a single source of information that communicates the condition of our waterways and the benefits they provide.
How often are Report Cards released?
Report cards are released annually.
Where do you get your data from, and how do you know it's accurate?
Our data is largely sourced from our Partners and includes existing government-funded monitoring programs, Port of Townsville monitoring programs and community (citizen science) data. The data is analysed by scientists and its accuracy is verified by the Reef Independent Science Panel.
How do we choose which data to use?
Report card indicators and scoring methods used for the report card are chosen based on locally relevant data and best available science. They are selected based on how likely the data will be available within the next five years, and if they are consistent with other report card programs across Queensland.
For the 2019 Report Card, additional monitoring which includes a new litter indicator, citizen science data on hard coral cover and 14 new monitoring sites in the Black Basin have also been included.
What scoring system is used?
The Report Card grades waterway health in an A-E format, similar to a school report. This system is used to show the environmental condition within each reporting region on the Report Card.
Water quality, habitat and the pressure associated with litter are individually graded for the seven zones, whilst an overall grade for the whole of Townsville is provided from the social and economic data. For more details on how the grades are determined, download the Methods for the Townsville Dry Tropics Annual Report Card and 2018-19 Results Report.
How is each indicator scored?
Each indicator is scored from 0 (very poor) to 100 (very good), with a very good score representing a healthy or largely unmodified environment (in respect to that indicator). Each indicator is scored using a statistical method appropriate to that indicator. These methods are devised by the Technical Officers working for each regional Report Card Partnership collaborating with relevant scientists within the Technical Working Group (TWG). They are reviewed and endorsed by the Reef Independent Science Panel.
The amount of data (sample size) is an important consideration when analysing data, with insufficient (too few) data points potentially resulting in inaccurate results. If there are insufficient samples for an indicator, the indicator will not be scored. This is to ensure the data is accurate. The sample size is considered on a case-by-case basis for each indicator.
To aggregate indicators into an indicator category and then into an index, rules have been developed to ensure there is sufficient information to accurately represent each index.
These rules are:
- ≥50% of measured indicators are required to be scored to aggregate the score into a score for the indicator category
≥60% of indicator categories must be scored to generate a score for the index - Overall scores for reporting zones are presented in the report card, even if not all indices are available.
The scientists within each Partnership work hard to ensure the methods to score the indicators are based on the best available science, are locally relevant, reflect changes to waterway health, and are consistent with other report card programs across Queensland. For more details about the reporting card methods, see the Methods for the Townsville Dry Tropics Annual Report Card.
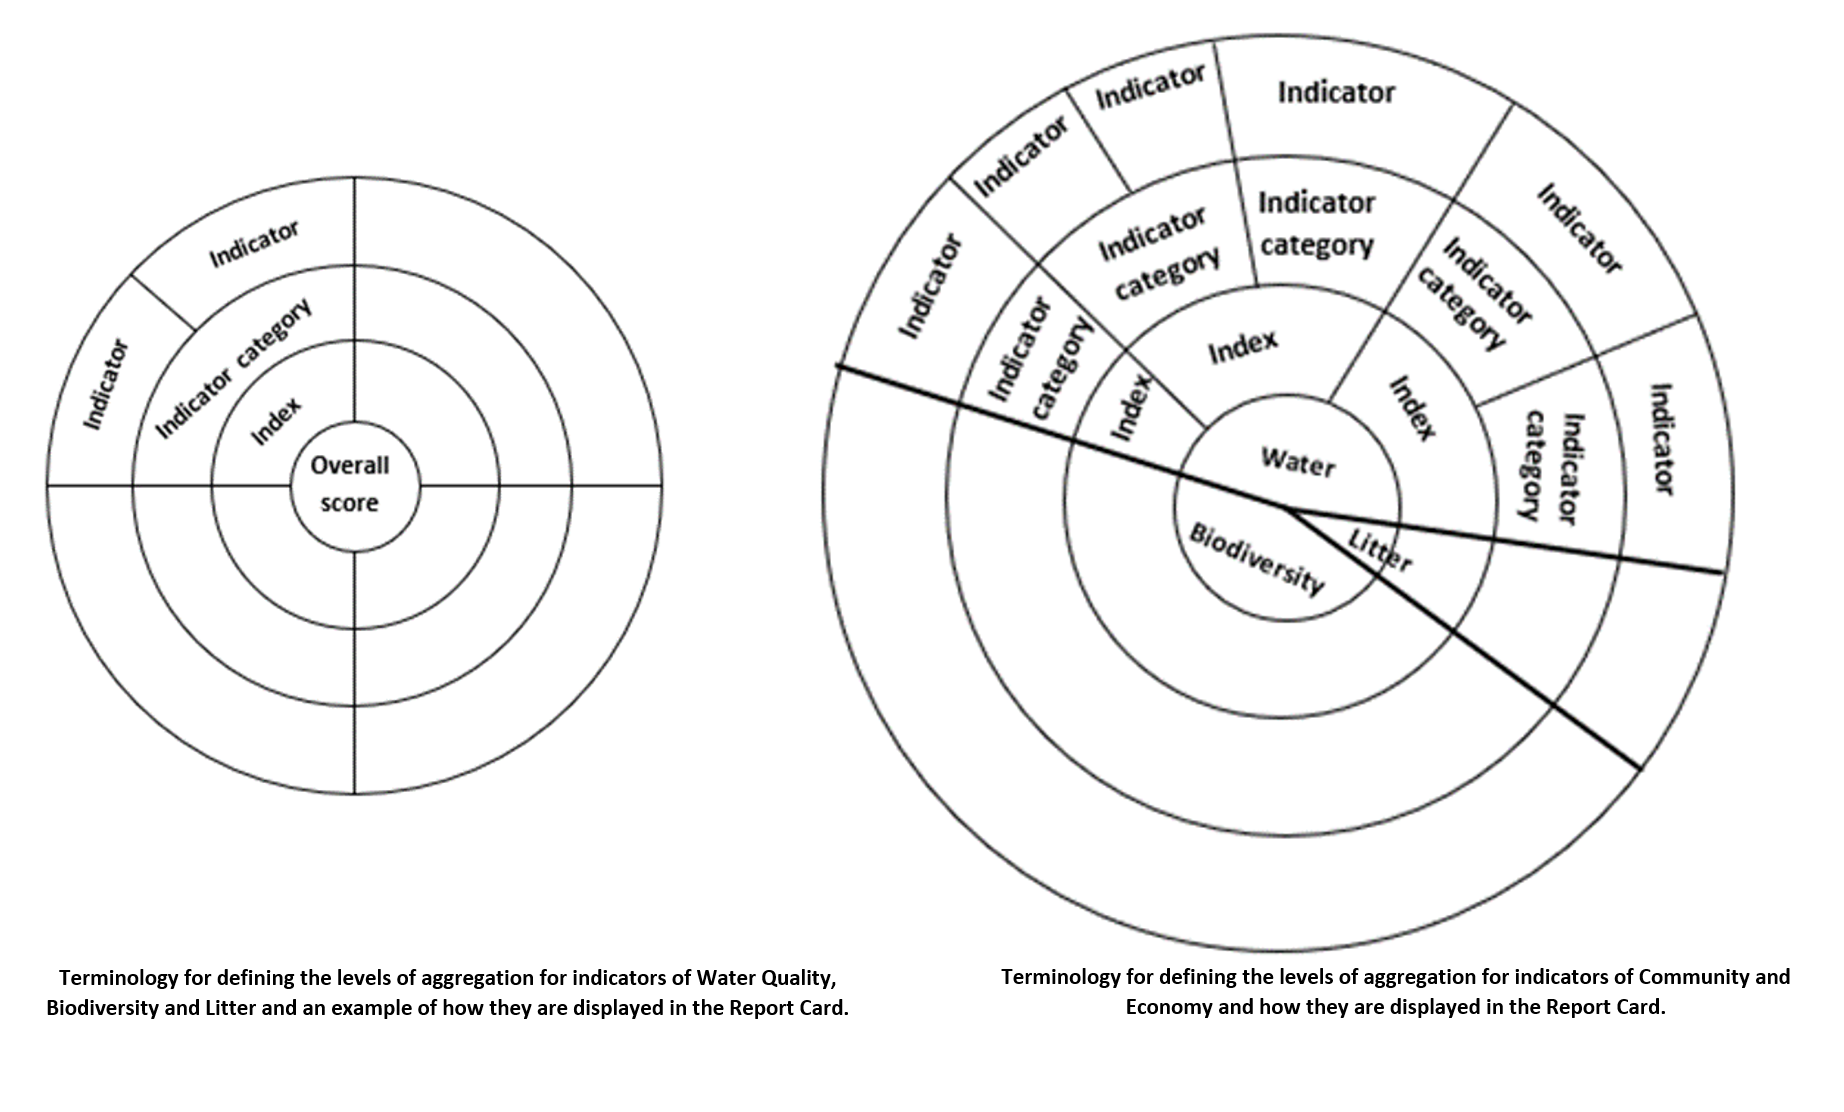
What is an indicator, indicator category, index, reporting category, and overall score?
Indicators are the measured feature in the ecosystem (e.g. particulate nitrogen, or dissolved oxygen).
An indicator category is generated by combining one or more related indicators (e.g. the category ‘nutrients’ is made up of both nitrogen and phosphorus).
An index is generated by combining related categories (e.g. the index ‘Water’ is made up of nutrients, water clarity and chlorophyll-a).
Reporting categories are a combination of indices. There are five reporting categories (Habitat, Water, Community, Economy and Litter) which are displayed as a ‘coaster’ within the Report Card.
An overall score is used for the community results in the place of a reporting category.
Examples of coasters.
How confident are we that the scores are accurate and what does the confidence measure?
The Report Card includes a qualitative confidence measure based on expert opinion, for each score for each indicator category within the Water and Habitat reporting categories. They are calculated using five criteria, with each criterion weighted based on their importance as shown in the table below.
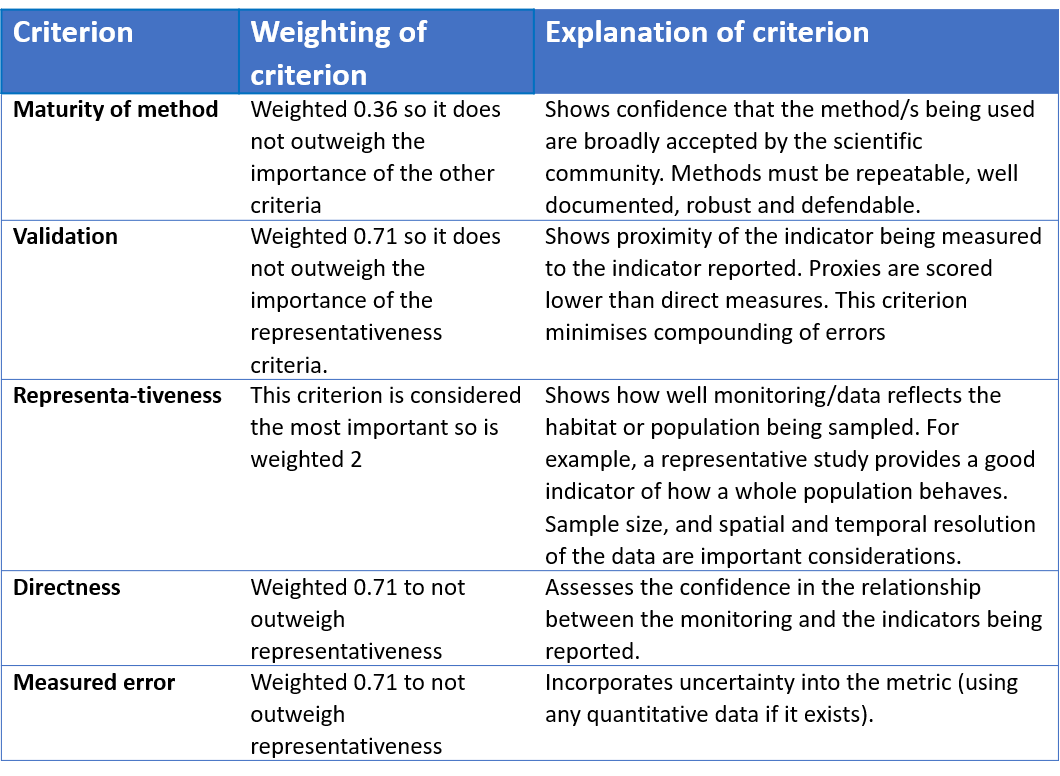
Each indicator is allocated a confidence score from very low (1) to very high (5). Indicators that receive low confidence (1-3) should be viewed with caution.
Low confidence indicates that the frequency the site was sampled was low, or the data provided represents a small portion of an area. For example, water quality in the Ross and Black freshwater basins had a low confidence rating because a limited number of sites were visited, and of those sites, only three months of data were provided. The confidence for these areas is likely to increase as more surveys are conducted over time.
What information is presented in a Report Card?
The results presented in the Report Card are divided into four environments (freshwater, estuarine, inshore marine and offshore marine) covering seven zones.
The zones are:
- Two freshwater zones called Ross freshwater basin and Black freshwater basin.
- Two estuarine zones called Ross estuarine zone and Black estuarine zone.
- Two inshore marine zones, called Cleveland Bay/Ross inshore marine zone (referred to as Cleveland Bay) and Halifax Bay/Black inshore marine zone (referred to as Halifax Bay).
- One offshore marine zone.
Across the seven zones there are three indices measured, which are:
- Water quality, based on nutrient concentrations, physical and chemical conditions and chlorophyll a concentrations.
- Habitat, including riparian, wetland, saltmarsh and mangrove extent and seagrass and coral condition.
- Freshwater fish (freshwater environment only)
Litter density (number of pieces collected per time) was also recorded at five sites across the Townsville Dry Tropics region in the 2019-2020 year.
Why is the data in the Report Card a year or more old?
The data used to prepare the Report Card is sourced from our Partners and includes industry and community data, ports monitoring and existing Townsville City Council, Queensland and Australian government-funded monitoring. Compilation of this data is a careful and considered process and takes some time.
In preparation for a report card, data needs to be collated and validated and undergoes comprehensive analysis. Before it is ready to be released in the report card, this preparation and analysis takes three to nine months, depending on the data set. Time is also needed to review the results and reports including thorough peer review by both the Technical Working Group and the Reef Independent Science Panel.
The Partnership is committed to minimising the time between data collection and report card release, to improve the timeliness and relevance of the report card.
Are any new indicators scored and added to Report Cards compared to previous ones?
For the first time in 2019-2020, the species diversity of freshwater fish was assessed within the Ross and Black freshwater basins. Species diversity was assessed based on two measures, namely: (1) the proportion of species expected to be present pre-development/pre-European settlement compared to the number of species detected, and (2) the proportion of species not native to the waterway (pest and translocated species) compared to the number of species native to the waterway.
Why are there grey areas in the Report Card?
Grey areas indicate there was no data available for the indicator to be scored. This is because either:
- there is no monitoring program that collects the data for the indicator within that reporting zone, or
- data is available but there is currently no suitable method to score the indicator.
The Partnership is committed to filling the gaps in the data. Greater information on the region will provide a better understanding of the ecological and socio-economic condition of the region.
Why were the impacts from the 2019 monsoon event less severe than expected?
Short, pulse events, such as floods, cyclones and other impact events can severely impact waterway ecosystem health. Environments that are relatively healthy and with low or no day-to-day pollution inputs have higher resilience and so can more readily recover from these events.
For example, in the 2019 Report Card, the results show that the flood impacts to the seagrass meadows in Cleveland Bay appear to be considerably less than originally expected. This is likely due to several years of good growing conditions prior to the flood, which provided inherent resilience to the impacts of the flood. As a result, seagrass biomass (the total amount of seagrass) declined but the overall area of seagrass meadows remained above the long-term average.
However, it is still possible there are long term impacts that are not yet recorded. Continued monitoring is needed to assess future waterway health.
For more information on seagrass monitoring in Cleveland Bay undertaken for the Port of Townsville, click here.
Why are litter scores shown for individual sites in the 2020 Report Card, rather than across the zones? What is litter density scored against to produce a grade?
The five sites were scored individually because there was insufficient data to roll up the scores into an overall score for each zone. Litter density at each site is compared to the average litter density at sites cleaned up from 2014-2018, which is the four-year period before management practices were implemented, such as the plastic bag ban (grey plastic bags) from supermarkets, banning cigarettes from certain venues, and campaigns to minimise the use of single-use plastics.
By comparing the current year of data to the amount prior to when management actions were implemented should enable managers to assess whether the management actions are reducing the amount of waste in the environment (for those specific categories). However, for trends to be accurately assessed, the same site needs to be cleaned yearly, which is currently not occurring. The Partnership is now working with community groups to undertake yearly clean ups at the same location.